


 5 / 11


49
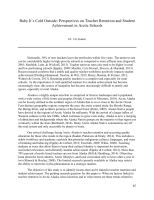
Table 1:
Teacher Retention Rates and Reading/Mathematics Proficiency between School Years (SY) 2010 to 2013
District
Teacher
Count
(N)
%
Reading /Math
Proficiency
2010-‐2013
%
Average
Retention
SD
%
SY09-‐10
%
SY10-‐11
%
SY11-‐12
%
SY12-‐13
Bering Strait
234
52/46
68
2.6
65
70
70
66
Denali
33
87/77
86
9.5
97
80
90
76
Iditarod
30
72/54
66
9.5
78
56
67
61
Nenana
26
81/61
91
10.5
92
100
76
96
Nome
56
69/59
83
7.9
93
80
74
83
North Slope
168
59/52
80
2.1
77
79
80
82
Northwest Arctic
153
49/45
77
7.3
85
80
72
69
Tanana
5
59/53
74
18.9
60
60
75
100
Yukon Flats
34
46/37
69
9.0
75
74
59
*-
Yukon-Koyukuk
56
76/58
78
12.0
81
91
78
62
Mean of Districts
80
65/54
77
2.4
80
77
74
77
Alaska Statewide
8862
78/69
82
2.3
90
89
89
90
Urban Districts
Anchorage
3142
82/72
94
1.2
93
94
93
95
Fairbanks
926
84/75
92
1.5
93
90
91
92
Matsu
913
88/76
95
2.0
93
93
97
96
* Unreported
Factors Identified from Interviews
The transcriptions of interviews reveal a variety of emerging factors related to teacher
retention. Twelve participants highlighted advantages of working in Arctic schools, which
included smaller class sizes, good student relationships, and opportunities to experience different
cultures, unique outdoor activities, and the beauty of the Arctic. Almost every educator (13)
interviewed for this study, however, cited struggling with the demands of working in a small
school, living in a rural remote Arctic community, and learning how to integrate into an
Indigenous community. Three of the first year teachers new to Alaska, and two of the teachers in