


 11 / 13


78
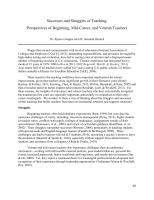
Table 1
Overall Frequencies by Type of Response
Codes
n
%
n
%
n
%
Complexity
Simple
45
60.00
46
61.33
91
60.67
Complex
29
38.67
28
37.33
57
38.00
Content
Self-focused
10
13.33
5
6.67
15
10.00
Professional
2
2.67
2
2.67
4
2.67
Teaching Practices: Instruction
6
8.00
2
2.67
8
5.33
Teaching Practices: Classroom
Management
2
2.67
4
5.33
6
4.00
Teaching Practices:
Social/Emotional Support
3
4.00
0
0.00
3
2.00
Teacher's Role in Specific Student
Issues
5
6.67
2
2.67
7
4.67
Teaching Practices: Assessment
1
1.33
2
2.67
3
2.00
Teaching Assignment
1
1.33
8
10.67
9
6.00
Professonial Development
2
2.67
0
0.00
2
1.33
Teacher Pride
10
13.33
0
0.00
10
6.67
Total Professional
32
42.67
20
26.67
52
34.67
Students
7
9.33
1
1.33
8
5.33
Learning
12
16.00
3
4.00
15
10.00
Social-emotional
5
6.67
1
1.33
6
4.00
Behavioral/Individual Dispositions
3
4.00
15
20.00
18
12.00
Total Students
27
36.00
20
26.67
47
31.33
Workplace
1
1.33
4
5.33
5
3.33
Administration
0
0.00
11
14.67
11
7.33
Coworkers
3
4.00
5
6.67
8
5.33
Physical Environment
0
0.00
0
0.00
0
0.00
Resources
0
0.00
0
0.00
0
0.00
School-related Activities
0
0.00
0
0.00
0
0.00
Roles and Responsibilities
0
0.00
0
0.00
0
0.00
School and District-Level Politics
0
0.00
0
0.00
0
0.00
Total Workplace
4
5.33
20
26.67
24
16.00
Parents
1
1.33
6
8.00
7
4.67
Technology
4
5.33
0
0.00
4
2.67
Other
2
2.67
7
9.33
9
6.00
Success
Struggle
Total